people reject unfairness
but normalize inequality


evidence from a large-scale experiment

mauricio bucca

puc chile

mario d. molina

nyu abu dhabi

September 3, 2025

the puzzle

the puzzle

  • A large body of research shows people are deeply averse to unfairness and resistant to large economic gaps.

  • Yet inequality keeps rising worldwide —often tolerated, rarely contested.

Why do people end up accepting the very inequalities they claim to oppose?

prevailing account

  • inequality is tolerated when it originates from a fair process (Starman 2017, NHB)

equal opportunity

unequal outcomes

prevailing account

  • inequality is tolerated when it originates from a fair process (Starman 2017, NHB)

unequal opportunity

unequal outcomes
  • yet, opportunities are not equally distributes so, why is still inequality tolerated?

prevailing account

  • limited awareness of systemic inequities

    • misinformation (McCall 2017, PNAS; Sands 2019, Nature)
    • biased belief systems reinforced by inequality itself—for example, through segregation (Newman 2015, AJPS; Mijs 2021, SR)

core assumption: people would reject inequality if they were fully aware of unfair origins.

a preview of what we find


evidence points to a dual-track process of fairness evaluation:

  • People rely on moral judgment to assess procedural fairness.

  • Their standards for acceptable disparities are anchored in the level of inequality they experience.

study design

challenges

  • unfeasible to manipulate societal inequality in observational data.

  • experiments often manipulate arbitrary inequalities, triggering perceptions of unfairness (Starman 2017, NHB).

  • ➡️ we need controlled experiment that resembles a real social environment:

    • individual are endowed with (un)equal opportunity
    • outcomes plausibly depend on individual choice
    • (!) yet, the actual role of skill or effort must be controlled.

experiment overview

  • pre-registered, interactive online card game (\(N = 3,335\))

  • conducted on cloudresearch connect (US sample)

  • fully crossed 2×2×2 design:

    • opportunity inequality: equal vs. opportunities details
    • outcome inequality: low vs. high payoff gap identification
    • social position: winner vs. loser
  • several game features suggest skill matters, but outcomes are driven almost entirely by chance or rules tested

sample

scheme inequality of opportunity inequality of outcomes social position payment n
1 equal high ($5 gap) loser $5 210
1 equal high ($5 gap) winner $10 199
2 equal high ($5 gap) loser $2.5 258
2 equal high ($5 gap) winner $7.5 200
3 unequal high ($5 gap) loser $5 208
3 unequal high ($5 gap) winner $10 203
4 unequal high ($5 gap) loser $2.5 205
4 unequal high ($5 gap) winner $7.5 202
5 equal low ($2.5 gap) loser $5 222
5 equal low ($2.5 gap) winner $7.5 210
6 equal low ($2.5 gap) loser $7.5 198
6 equal low ($2.5 gap) winner $10 200
7 unequal low ($2.5 gap) loser $5 214
7 unequal low ($2.5 gap) winner $7.5 200
8 unequal low ($2.5 gap) loser $7.5 203
8 unequal low ($2.5 gap) winner $10 203

experimental conditions and payment schemes

experimental platform

two-player, 5-round game

  • each round, players receive 7 random tokens

  • exchange rules before each round:

    • random exchange = equal opportunity
    • regressive exchange = unequal opportunity
  • overall winner/loser = most rounds won

  • payoffs: payoff gaps of $2.5, (low inequality) or $5 (high inequality).

dependent variables

  • Fairness (1–7 slider)
    1 = completely unfair, 7 = completely fair
  • attributions: ,ost/lear important factor
    • luck, talent, rules
  • Fair Distribution
    “Keeping the total reward constant, what would be a fair distribution between winner and loser?”
    Slider initialized at actual distribution

    • Rank Preservation: did participants preserve winner > loser?
    • Fair Inequality: winner’s share in proposed distribution.
    • Jasso’s-like Justice: log ratio of observed vs. fair inequality.

findings

rejection of unfairness

  • unequal opportunities produce a substantial drop in perceived fairness

  • the size of the outcome gap has no detectable effect

  • across all conditions, winners judge outcomes as fairer than losers

normalization of inequality

rank preservation

  • across all conditions, a clear majority favor unequal reward distributions that preserve the original winner–loser ranking

fair inequality

  • perceived “fair” inequality mirrors participants’ exposure

  • those in high-inequality conditions endorse larger gaps than those in low-inequality conditions

  • holds regardless of opportunity distribution or personal outcome

  • winners see more inequality as fair

experienced vs fair inequality (Jasso’s justice)

  • losers saw actual inequality as slighlty greater than what they considered fair

  • winner in high-inequality viewed observed gaps as fair

  • winners in low-inequality felt underpaid and favored larger winner shares

causes of inequality

  • winners credited talent — even when game was rigged.

  • losers, especially under high inequality, less likely to credit talent.

  • RA more often cited luck; RE more often cited rules.

other findings


  • selective effects on broader societal beliefs (GSS questions, importance of family wealth and talent to get ahead) details

  • no detectable effect on redistributive behavior (dictator game and ultimatum game) details.

main takeaway

Why do people accept (unfair) outcome inequalities if they reject inequality of opportunity ?

  • No need to assume limited awareness of unfairness

  • We document a dual-track process where:

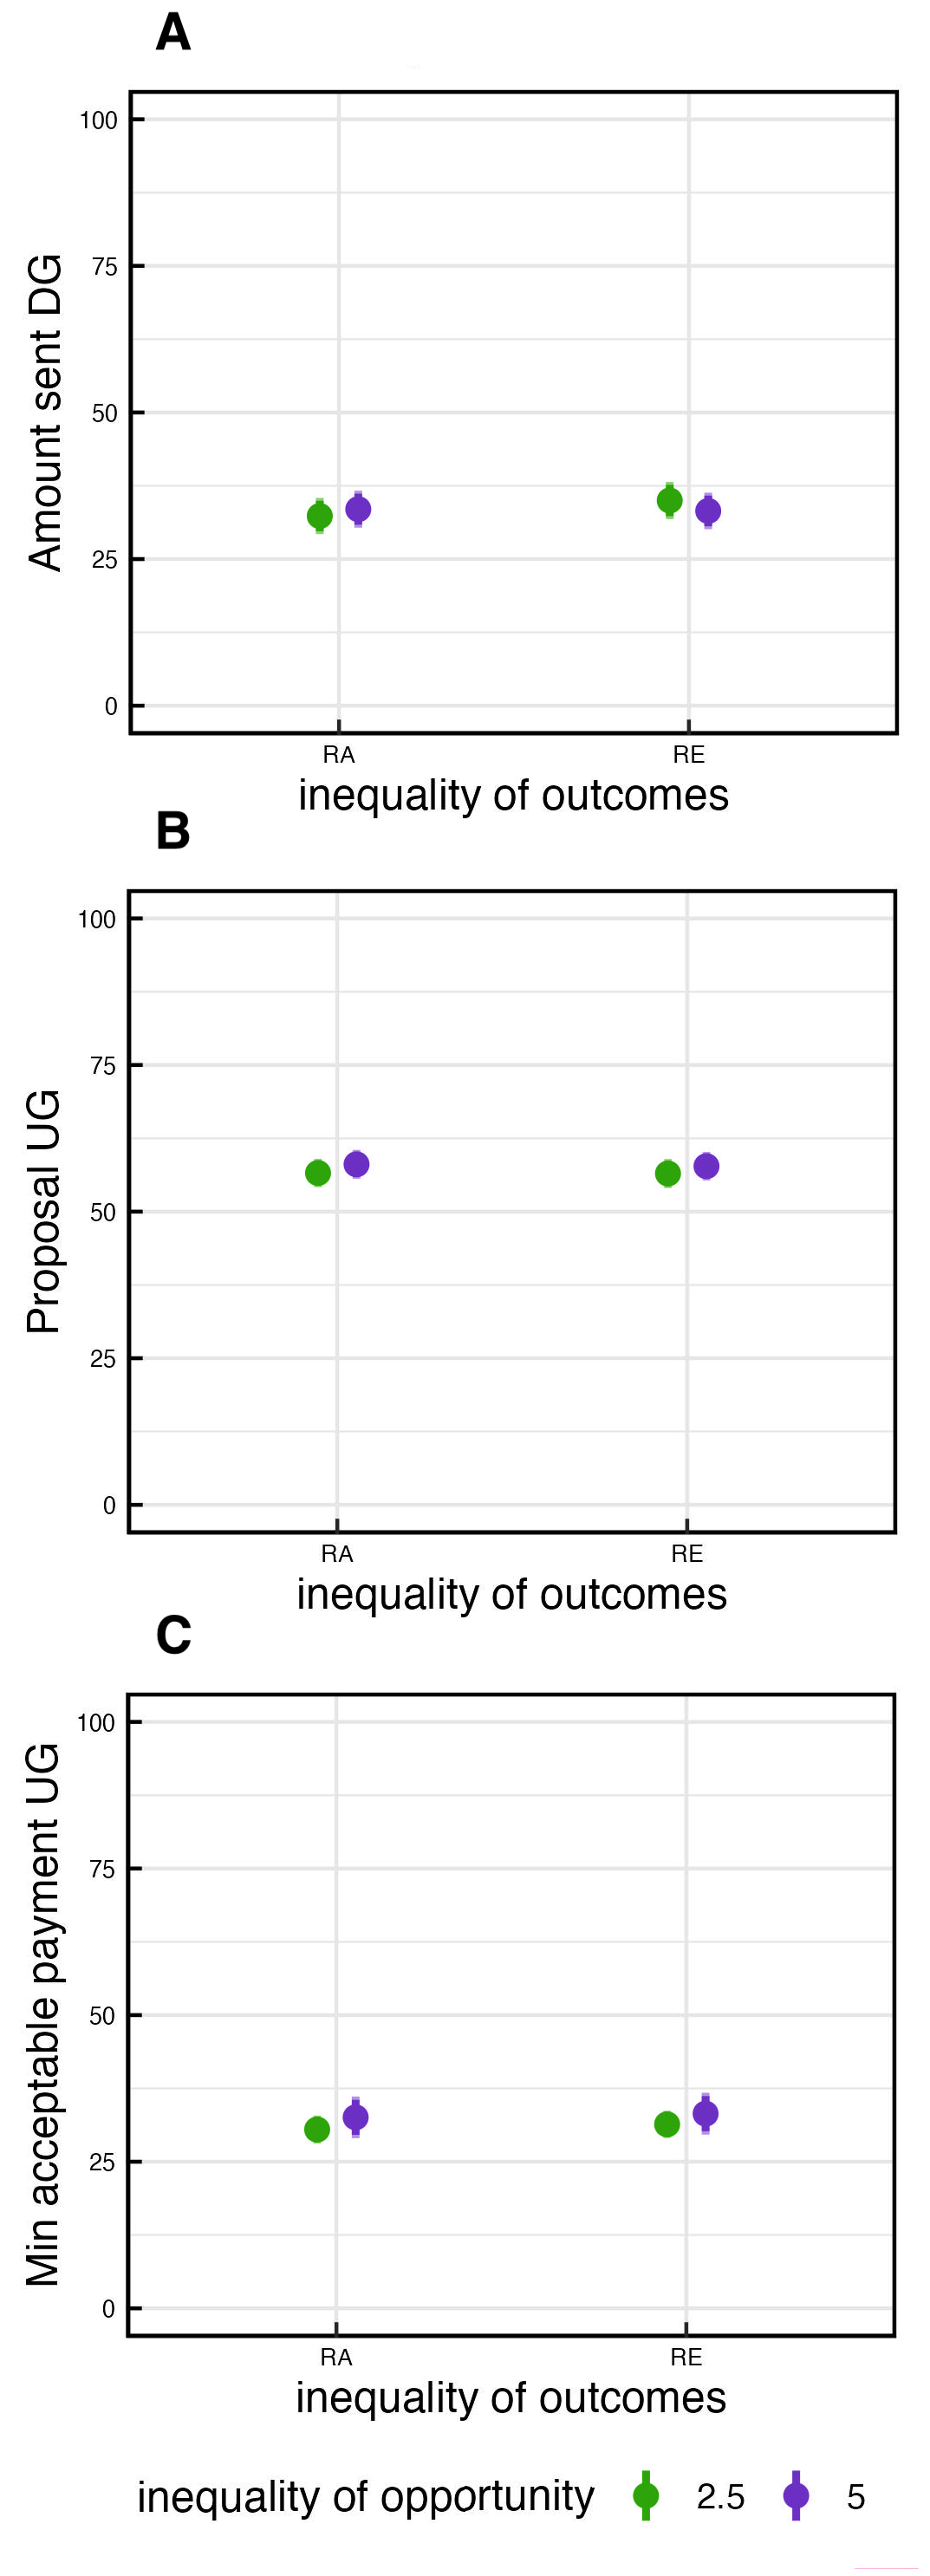
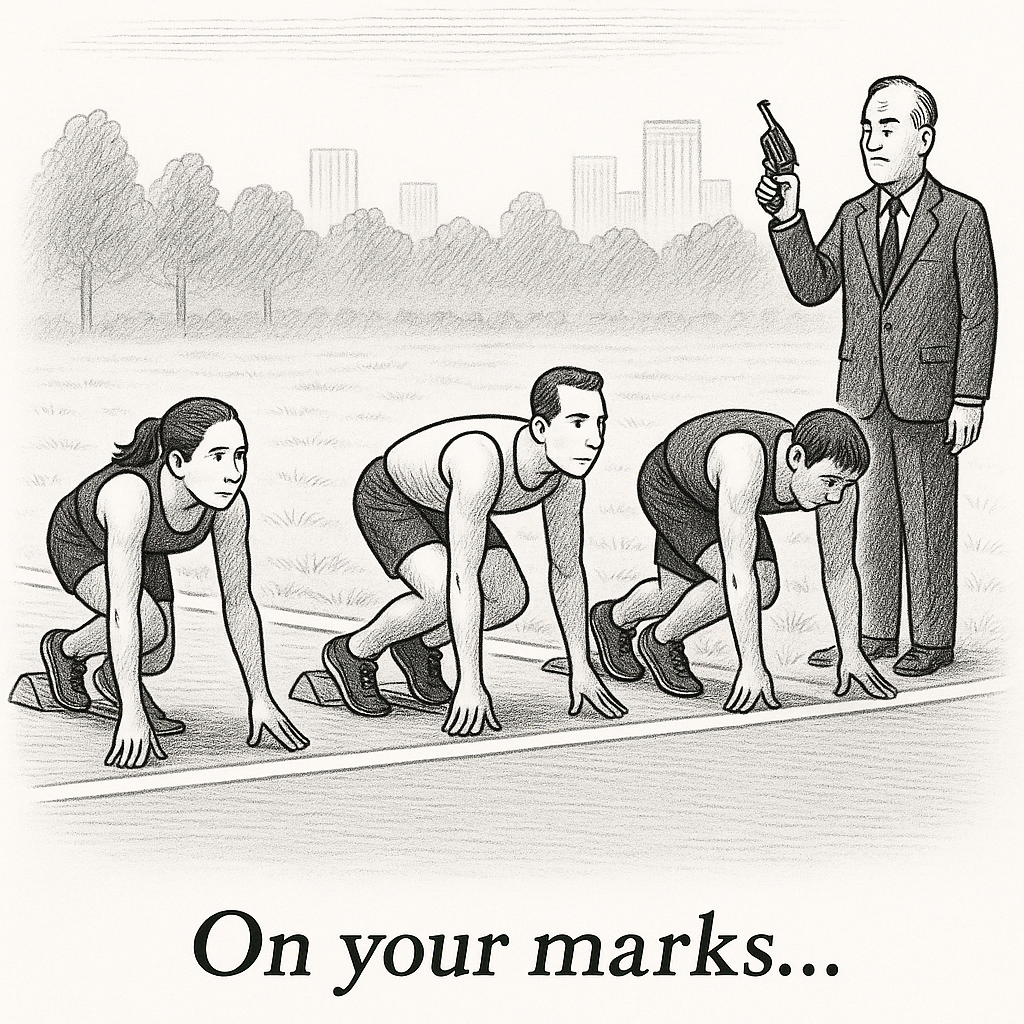
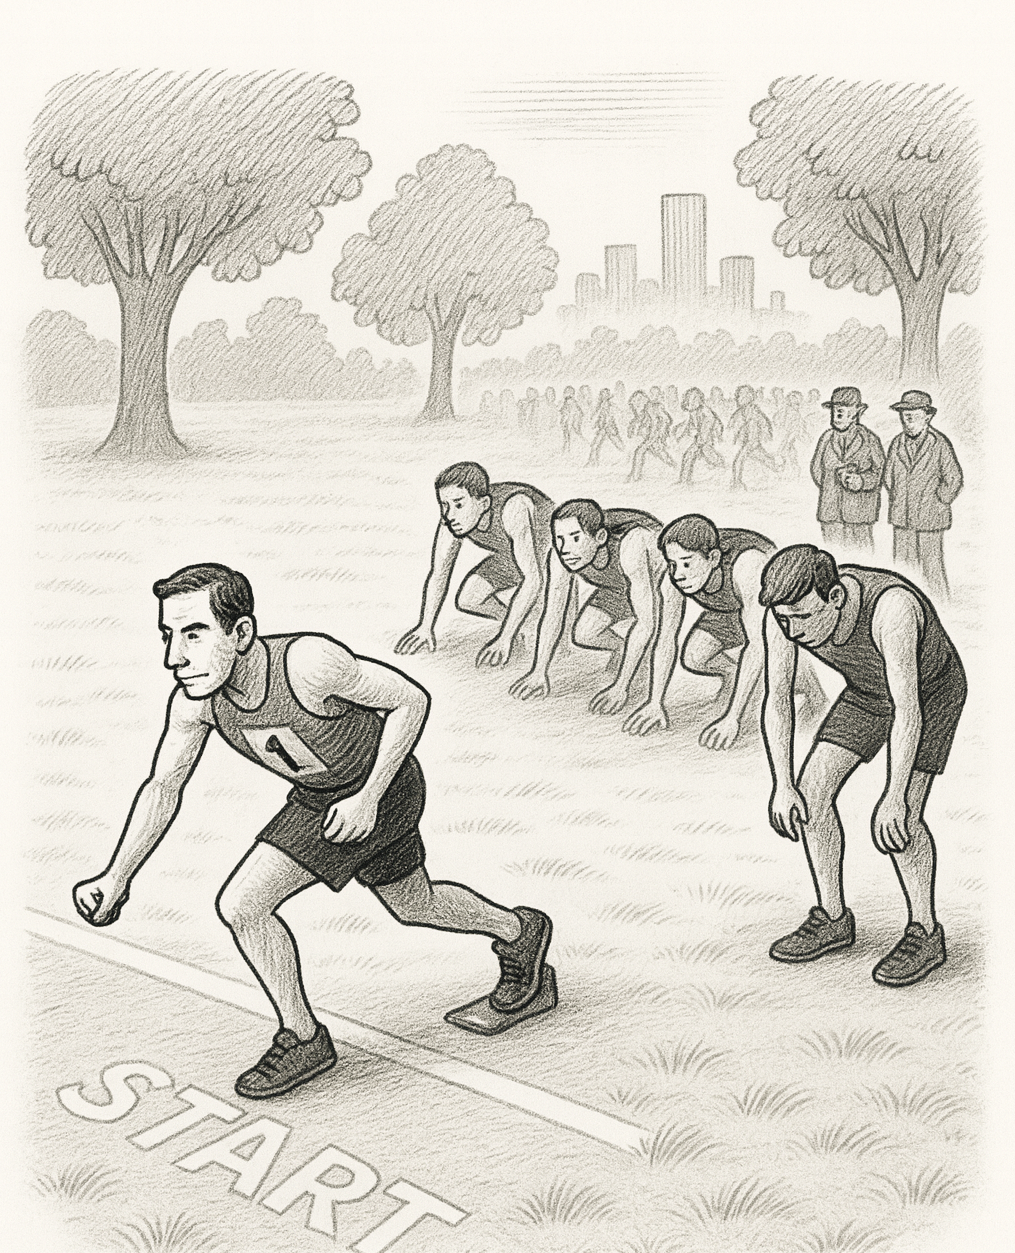
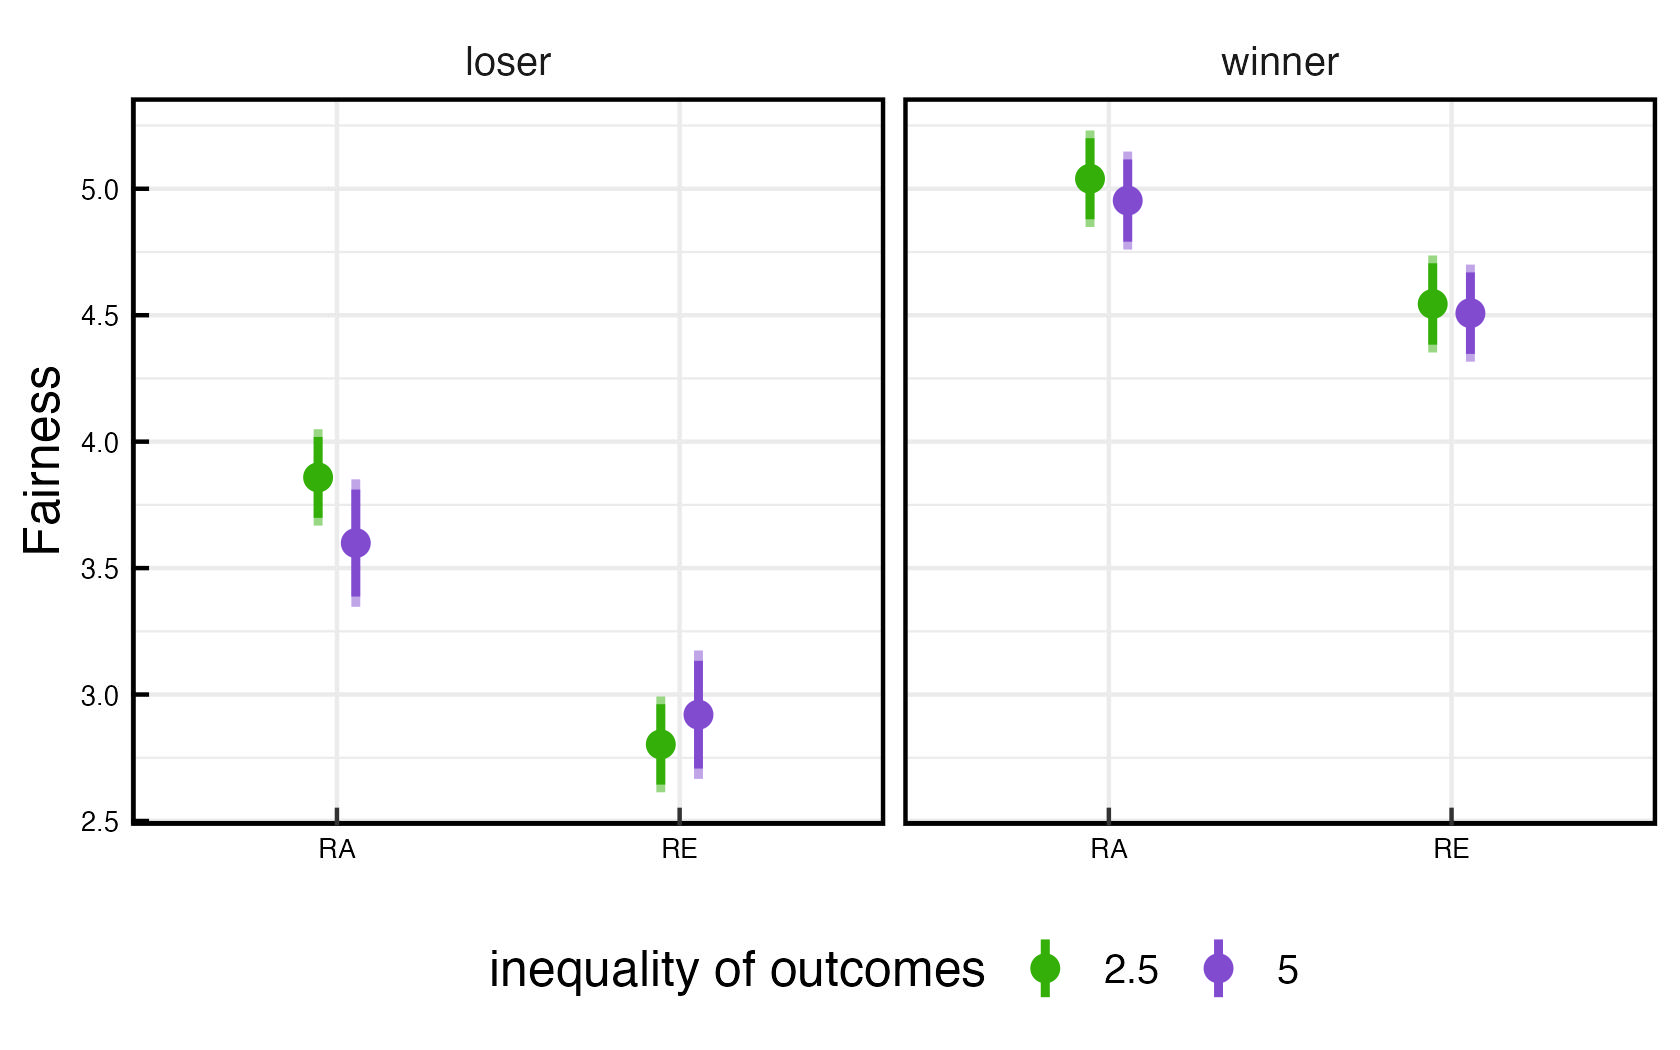
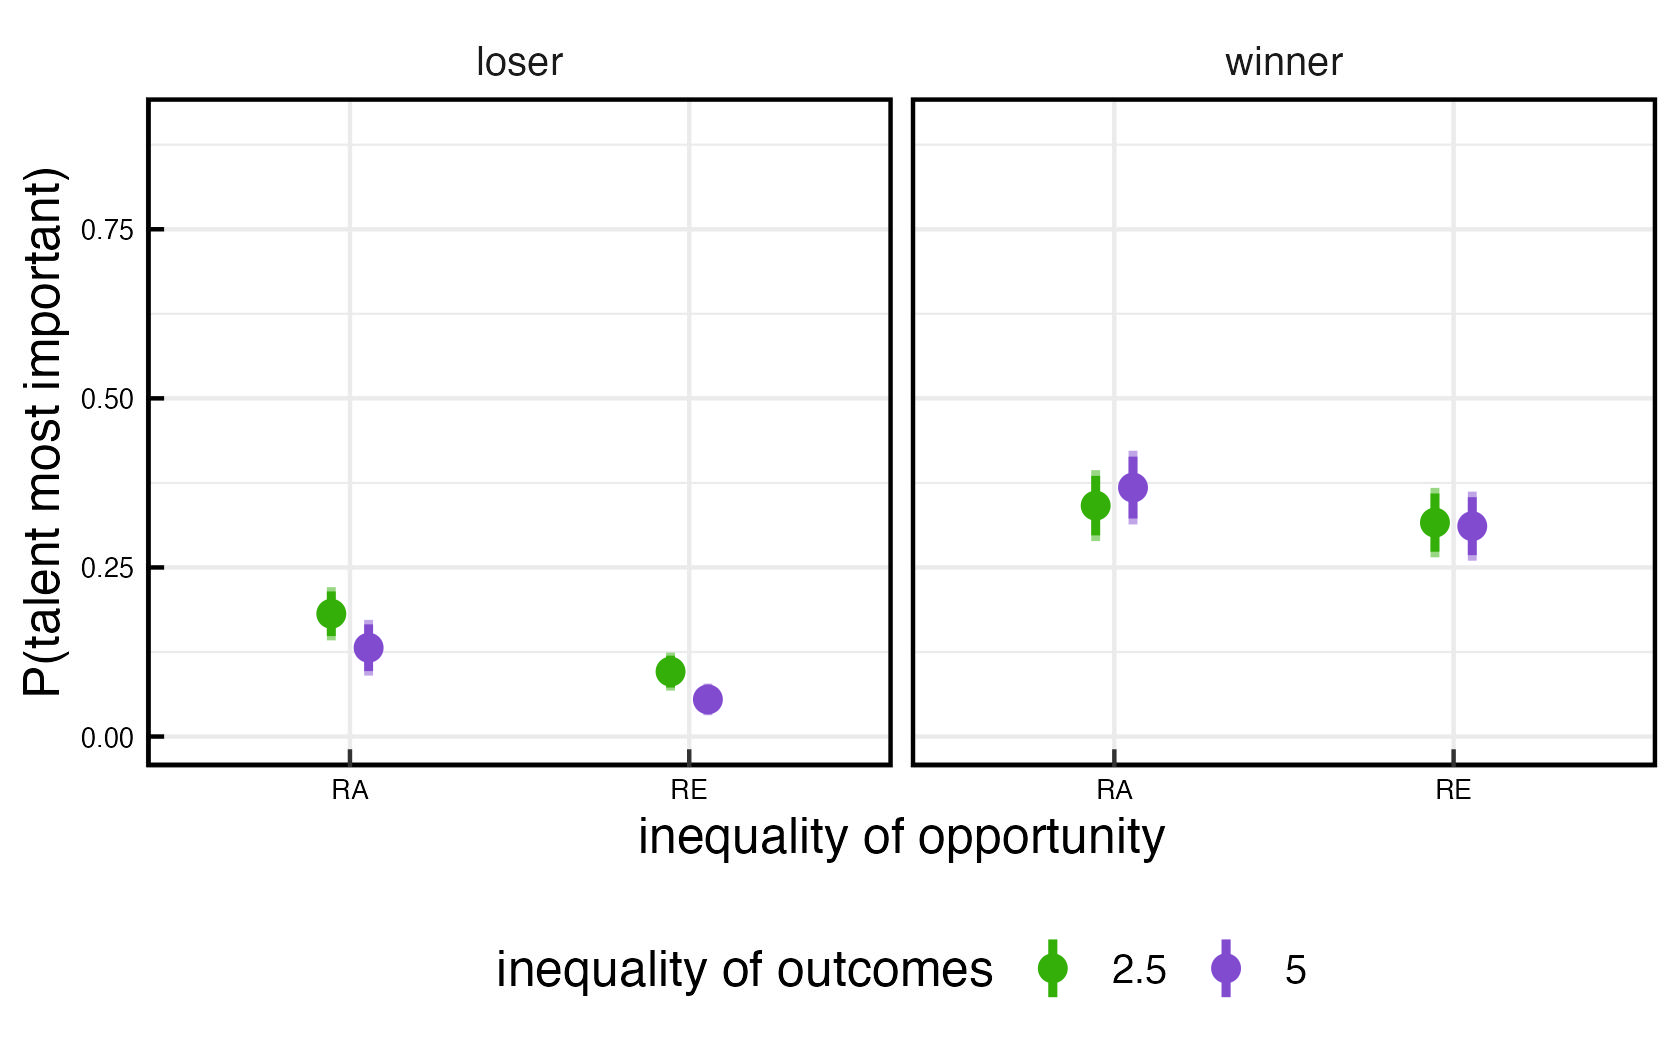
  • Rejection of procedural unfairness: Unequal opportunities are seen as less fair than equal opportunity, but the size of outcome inequality doesn’t affect fairness evaluations.

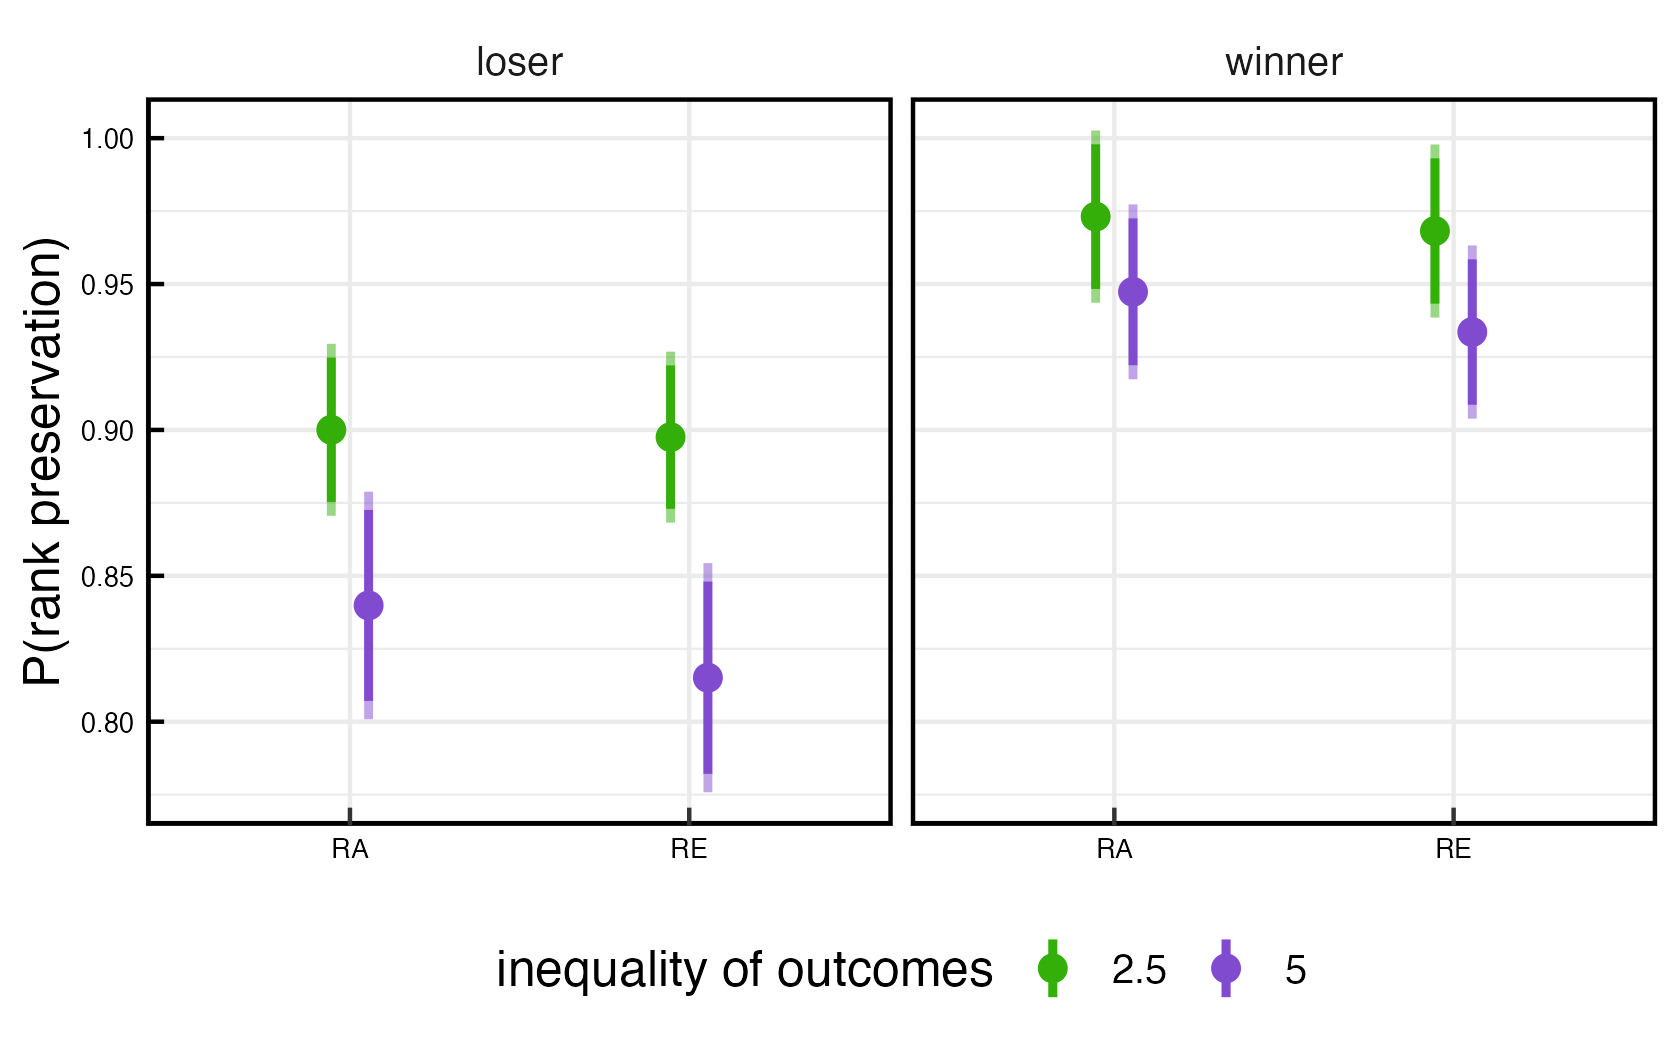
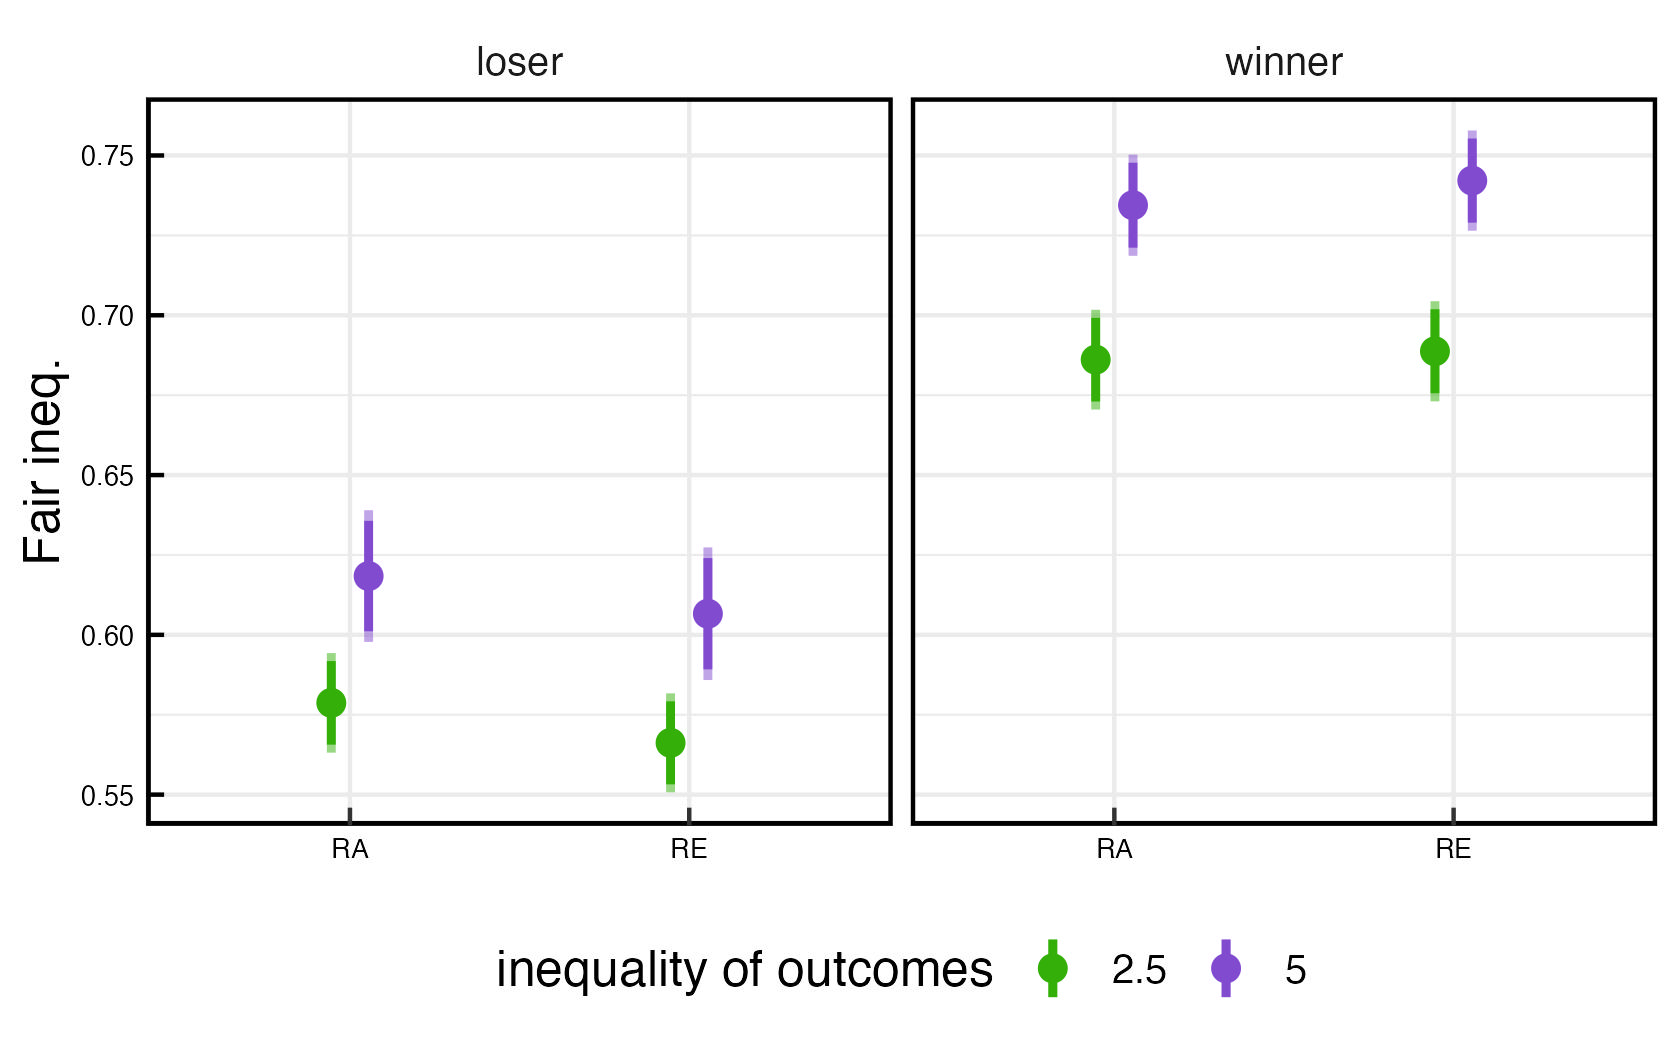
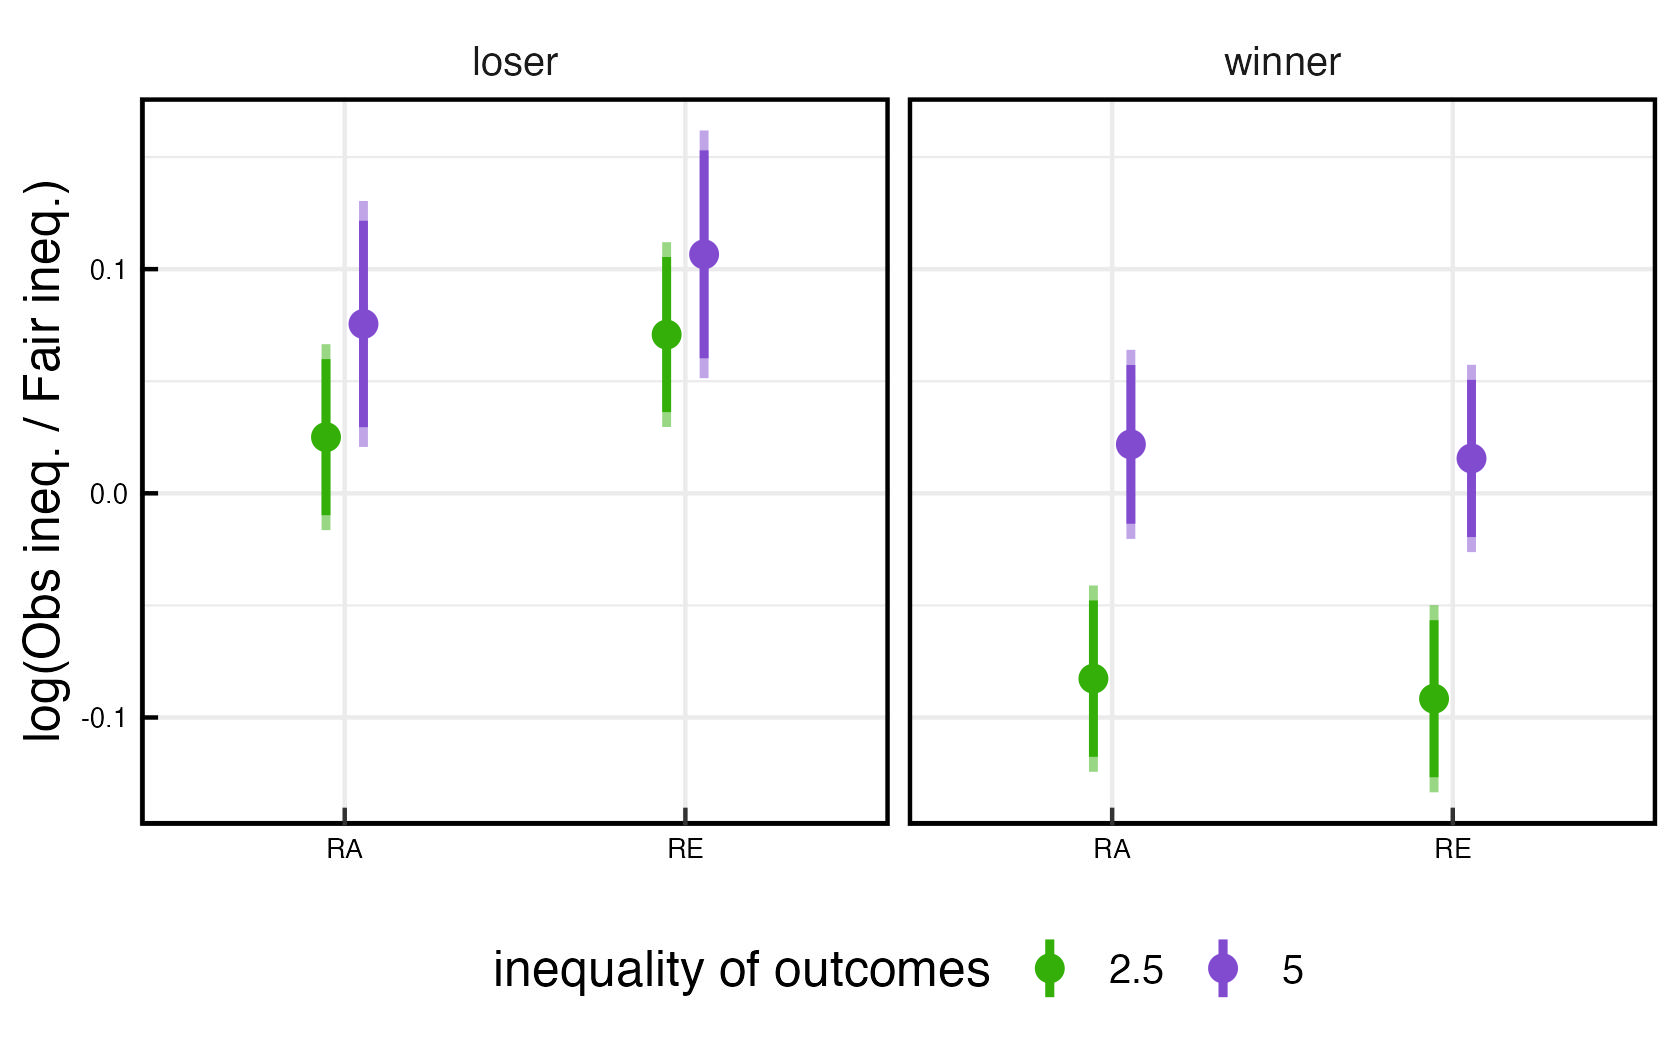
  • Normalization of inequality: People anchor their evaluation of outcome inequality in what they experience; opportunity distribution doesn’t affect tolerance for disparities.

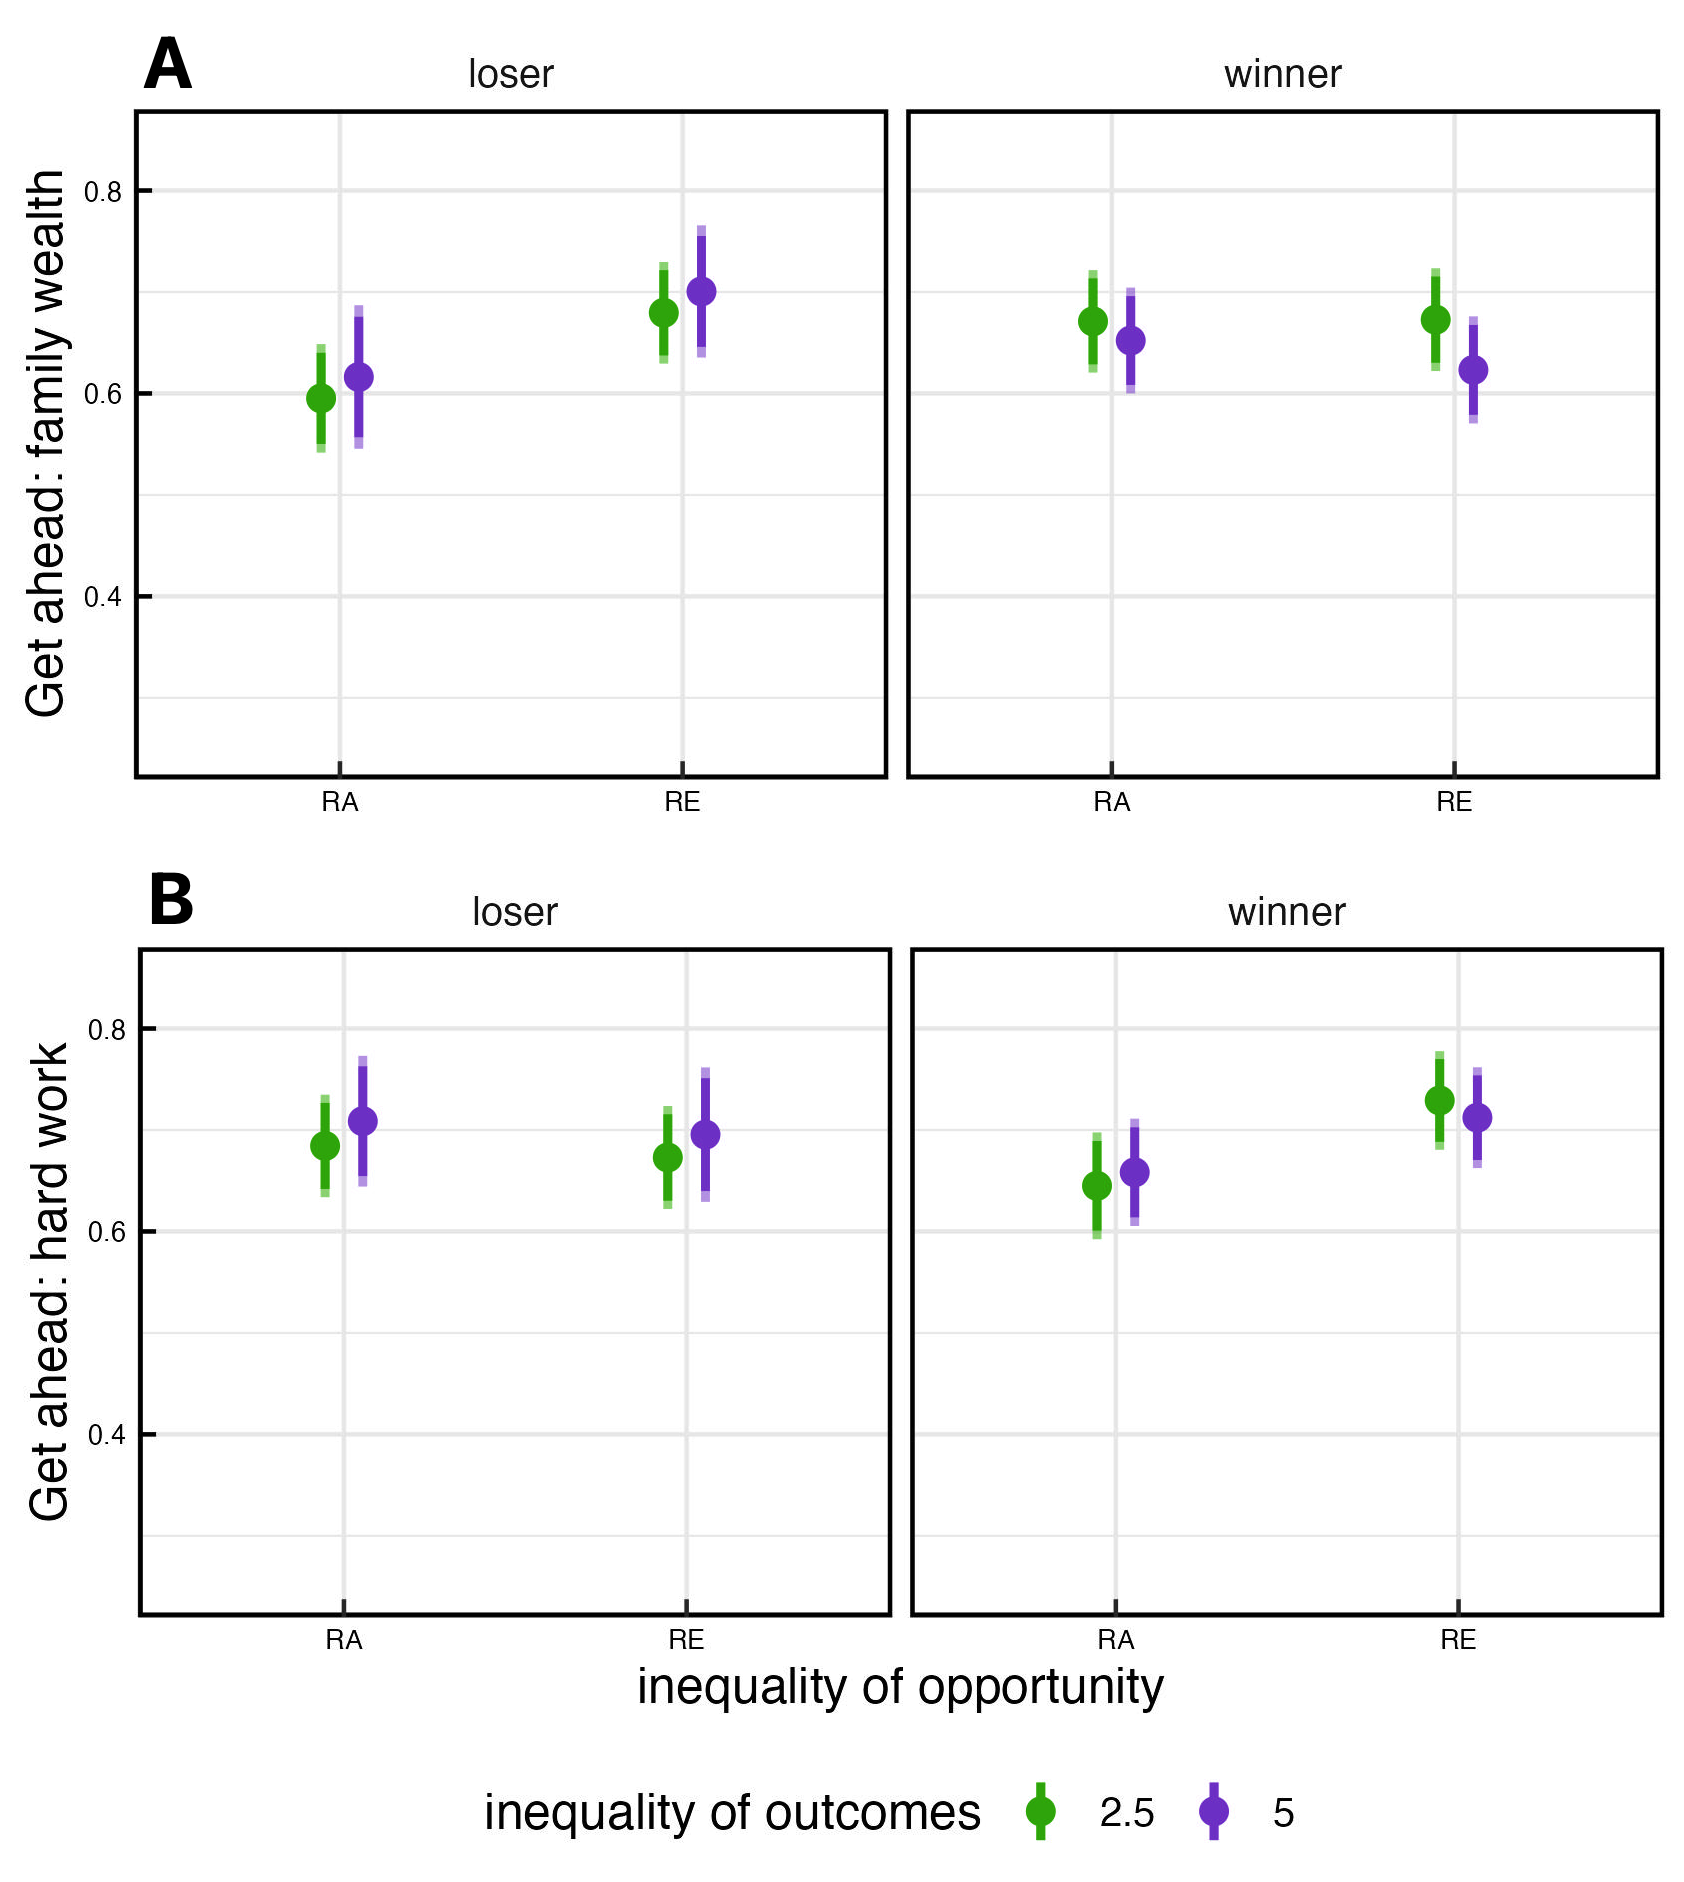
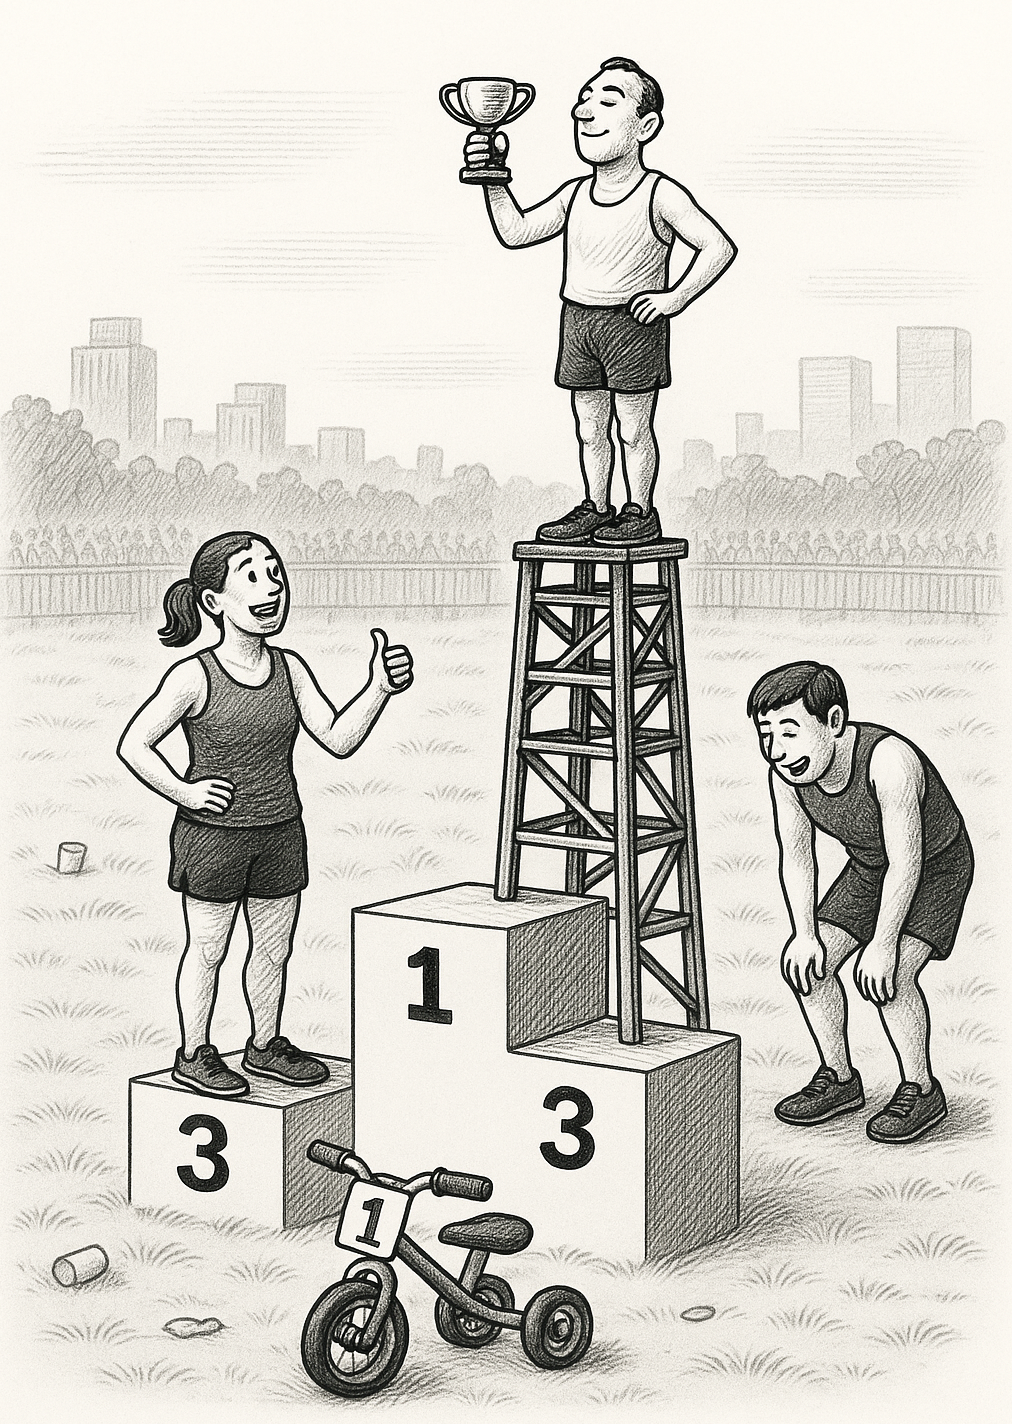
  • Personal consequences amplify effects: Winners see more fairness, accept larger gaps, and credit talent—regardless of rules or results.

discussion

  • provides microfoundations for the macro puzzle of persistent inequality.
  • unifies cognition, fairness judgments, and stability of unequal arrangements.

so …

THEY DON’T! THEY JUST GET USED TO IT.

thank you

mauricio bucca — puc chile · mebucca@uc.cl

mario d. molina — nyu abu dhabi · mdmolina@nyu.edu

supplementary materials

outcome treatment

  • \(Y_i\): outcome for individual \(i\)
  • \(\text{Position}_i \in \{\text{winner}, \text{loser}\}\): social position
  • \(\mathbb{I}^{\text{out}} \in \{\text{high}, \text{low}\}\): outcome inequality level
  • \(P_i \in \{\$10,\ \$7.5,\ \$5,\ \$2.5\}\): payment received by individual \(i\)

causal effect of outcome inequality: \(\mathbb{E}[Y \mid \mathbb{I}^{\text{out}}=\text{high},\ \text{Position}_i=p,\ P_i=p^*] - \mathbb{E}[Y \mid \mathbb{I}^{\text{out}}=\text{low},\ \text{Position}_i=p,\ P_i=p^*]\)

  • compares same position (winner/loser),
  • with same payoff \(P_i = p^*\),
  • but different inequality levels (high vs. low).

earnings are fixed ⇒ differences reflect exposure to inequality only

opportunity treatment

RA/RE induces equal/unequal opportunity

limited role of talent/effort

Skill minimized; success ≈ hand strengts

external validity: GSS items

redistributive behavior

power analysis

  • \(N = 3,335\), 2×2×2 factorial.
  • Detectable effects:
    • Main: 7–8 p.p. differences
    • 2-way: ~10 p.p.
    • 3-way: ~14–16 p.p.
  • Bonferroni corrected α = 0.0083.

sample composition

  • Sample size: 3,333 participants

  • Average age: 39 years (range: 18–80)

  • Education: Nearly half hold a college degree; 17% have graduate/professional degrees

  • Gender: 53% female, 45% male, 1.5% other

  • Income: Broadly distributed, with most between $25,000 and $99,999

  • Political ideology: Average score 6 (on a 1–9 scale)

  • Political party: Majority identify as Democrat or Democrat-leaning; 18% Republican or Republican-leaning; 14% Independent

  • Race: 70% White, 12% Black, 9% Asian, 8% Latino/Hispanic, 3% Other

  • Region: 30% West, 27% South, 23% Midwest, 20% Northeast

  • Religion: 44% report no religion; 22% Protestant/Lutheran; 16% Catholic; 14% Other; small percentages Jewish and Muslim