| Rut | 1.a | 1.b | 2 | 3.a | 3.b | 3.c | 3.d | Nota | P(Nota < tunota) |
|---|---|---|---|---|---|---|---|---|---|
| 21805638-5 | 7 | 7.0 | 5.0 | 7 | 7.0 | 7.0 | 4.5 | 6.22 | 0.79 |
| 21701909-5 | 7 | 7.0 | 1.0 | 7 | 5.0 | 7.0 | 7.0 | 5.50 | 0.64 |
| 21575827-3 | 4 | 7.0 | 5.0 | 7 | 7.0 | 7.0 | 1.0 | 5.40 | 0.61 |
| 21551561-3 | 7 | 4.0 | 7.0 | 7 | 7.0 | 7.0 | 7.0 | 6.70 | 0.89 |
| 19246028-K | 7 | 2.0 | 3.7 | 7 | 1.0 | 7.0 | 4.5 | 4.57 | 0.46 |
| 21725304-7 | 7 | 7.0 | 7.0 | 7 | 3.0 | 1.0 | 1.0 | 4.60 | 0.50 |
| 21543296-3 | 7 | 3.5 | 6.5 | 7 | 7.0 | 2.0 | 1.0 | 4.90 | 0.54 |
| 21803109-9 | 7 | 7.0 | 7.0 | 6 | 7.0 | 5.5 | 7.0 | 6.62 | 0.82 |
| 20591970-8 | 3 | 2.0 | 1.0 | 6 | 1.0 | 1.0 | 1.0 | 2.05 | 0.11 |
| 20965392-3 | 7 | 7.0 | 2.0 | 7 | 1.0 | 1.0 | 1.0 | 3.30 | 0.27 |
| 21750628-K | 2 | 1.0 | 4.0 | 7 | 4.0 | 1.0 | 1.0 | 3.05 | 0.21 |
| 21530251-2 | 7 | 7.0 | 3.7 | 5 | 1.0 | 1.0 | 1.0 | 3.34 | 0.32 |
| 21816972-4 | 7 | 7.0 | 7.0 | 7 | 6.5 | 7.0 | 2.0 | 6.18 | 0.75 |
| 21445742-3 | 7 | 7.0 | 5.0 | 7 | 7.0 | 7.0 | 3.0 | 6.00 | 0.71 |
| 21331548-K | 7 | 7.0 | 5.5 | 7 | 7.0 | 7.0 | 7.0 | 6.70 | 0.89 |
| 21010583-2 | 7 | 7.0 | 2.0 | 7 | 1.0 | 1.0 | 1.0 | 3.30 | 0.27 |
| 20833519-7 | 7 | 7.0 | 7.0 | 7 | 7.0 | 7.0 | 7.0 | 7.00 | 1.00 |
| 21618740-7 | 7 | 3.5 | 3.5 | 7 | 7.0 | 7.0 | 7.0 | 5.95 | 0.68 |
| 21627537-3 | 7 | 7.0 | 2.0 | 5 | 1.0 | 1.0 | 1.0 | 3.00 | 0.18 |
| 21417889-3 | 7 | 3.5 | 3.0 | 5 | 1.0 | 1.0 | 1.0 | 2.85 | 0.14 |
| 21763047-9 | 7 | 1.0 | 3.5 | 7 | 5.0 | 7.0 | 7.0 | 5.40 | 0.57 |
| 21180558-7 | 4 | 7.0 | 7.0 | 7 | 7.0 | 7.0 | 7.0 | 6.70 | 0.89 |
| 21627470-9 | 2 | 1.0 | 1.0 | 5 | 1.0 | 1.0 | 1.0 | 1.70 | 0.07 |
| 21388164-7 | 7 | 4.0 | 6.0 | 1 | 4.0 | 2.0 | 1.0 | 3.50 | 0.36 |
| 21207645-7 | 7 | 7.0 | 6.0 | 6 | 4.0 | 1.0 | 1.0 | 4.40 | 0.43 |
| 21043499-2 | 2 | 7.0 | 4.0 | 7 | 7.0 | 1.0 | 1.0 | 4.10 | 0.39 |
| 21650971-4 | 7 | 7.0 | 7.0 | 7 | 7.0 | 7.0 | 6.0 | 6.85 | 0.96 |
| 20828390-1 | 2 | 4.0 | 1.0 | 1 | 1.0 | 1.0 | 1.0 | 1.40 | 0.04 |
Notas Prueba 1 (SOL114)
Notas
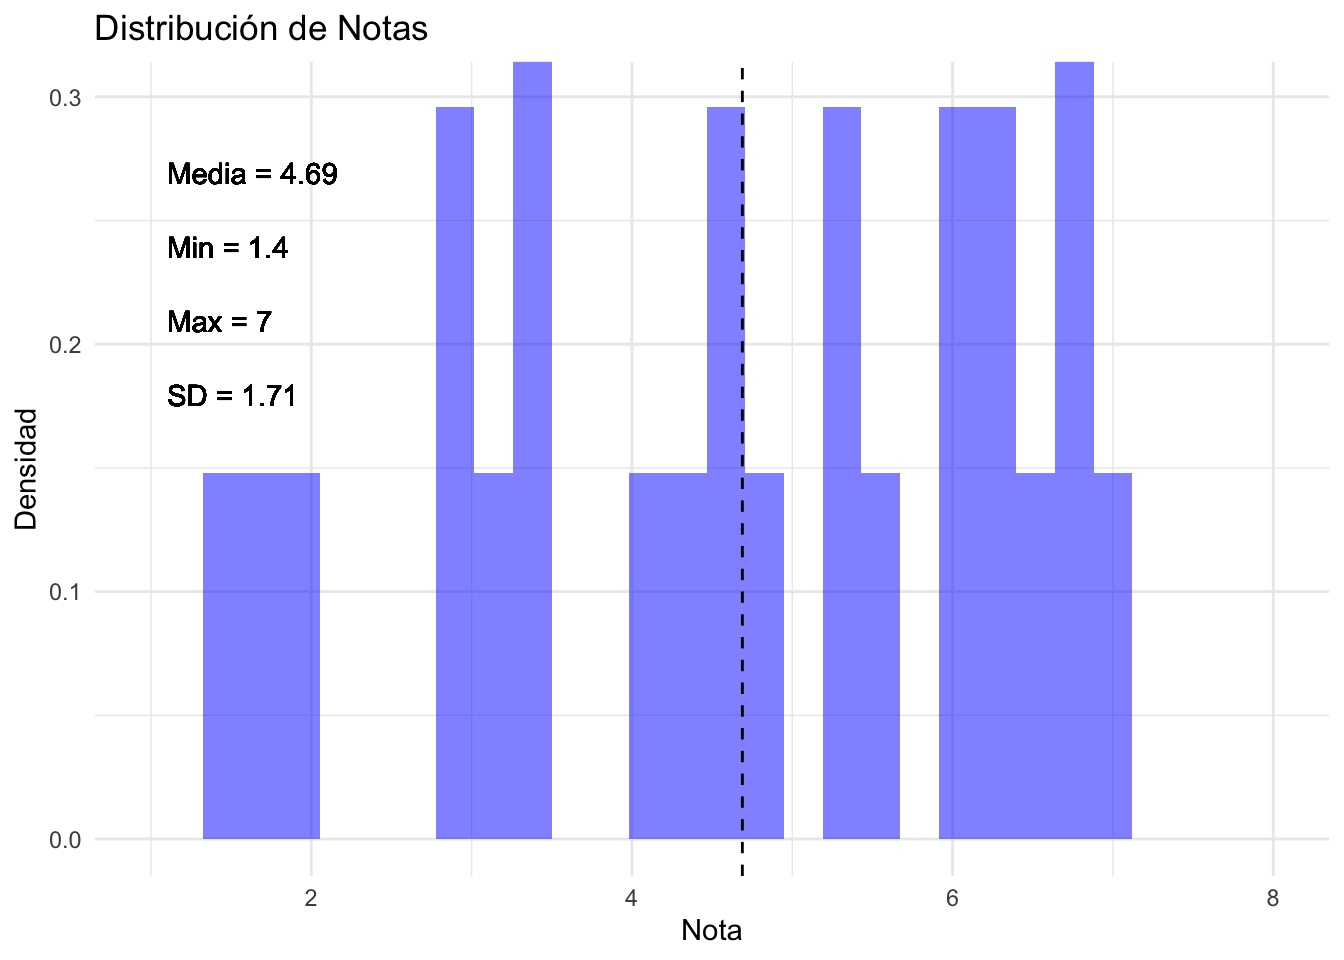
Resumen estadístico
El siguiente gráfico muestra la distribución de las notas:
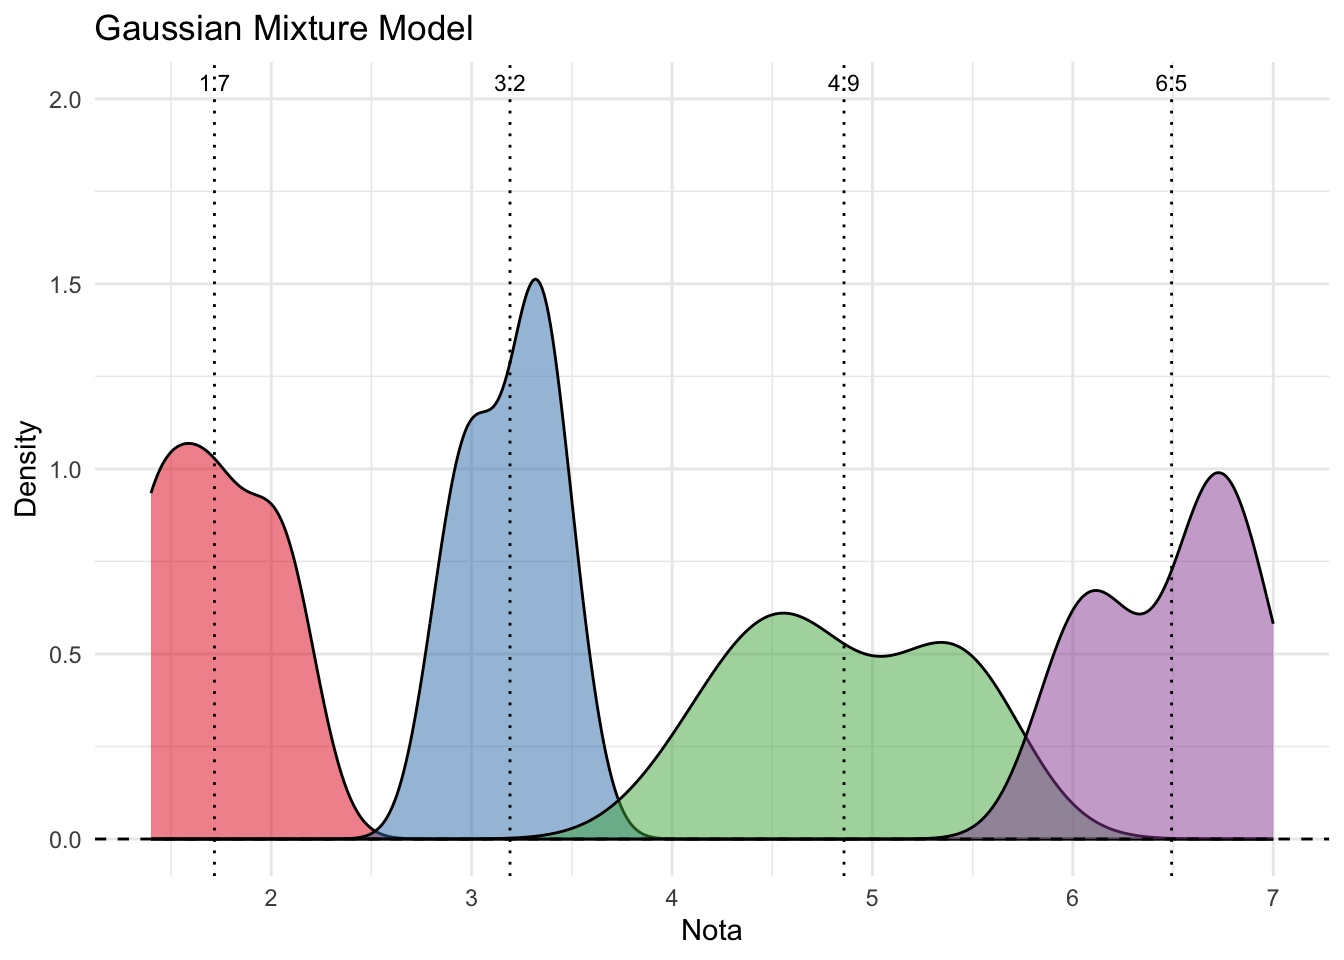
Usando un Gaussian mixture model encontramos 4 clusters de notas:
Desagregando por pregunta:
| Variable | Promedio | Min | Max | SD |
|---|---|---|---|---|
| 1.a | 5.93 | 2 | 7 | 1.94 |
| 1.b | 5.30 | 1 | 7 | 2.29 |
| 2 | 4.41 | 1 | 7 | 2.17 |
| 3.a | 6.18 | 1 | 7 | 1.63 |
| 3.b | 4.45 | 1 | 7 | 2.67 |
| 3.c | 4.02 | 1 | 7 | 2.95 |
| 3.d | 3.25 | 1 | 7 | 2.73 |